What remote-sensed data can tell us about ‘active’ forest management.
VIIRS, MODIS, NIROPS, MTBS
A mouthful of acronyms point to data available as public information to interested private individuals or organizations, since they are funded by your taxpayer dollars. All these various forms of remotely-detected wildfire information can yield important insights on fire spread and severity, especially in the wake of such a rare continent-wide katabatic or “Foehn” wind event, as the one just experienced down the West Coast of North America.
These ill-winds, often from the east, bearing hot, dry inland air go by many names – Diablo, Santa Ana, Chinook. These are all regional names for the winds that cause the hair on the back of a firefighter’s neck to stand up. A whiff of smoke…fight or flight? The cold blast of Arctic air that caused unusual snow earlier this month in Colorado, displaced such a huge pocket of dry inland air to the west, that these winds were triggered all down the Cascade and Sierra Front Range from Washington State to Southern California. It was truly, we must hope, a once-in-a-lifetime force of nature. Of course, in the broadest sense, climate science tells us that the extreme weather events become more common… What we can say about the climate influence, is that the already dry Mediterranean summer was made much drier with a record-setting dry period leading up to the wind event. The stage had been set. The graph below represents the energy release component (ERC) for the Rodeo Valley remote automated weather station (RAWS) near the August Complex, currently the largest wildfire in recorded California history at over 800,000 acres. ERC is a measure of fuel dryness. As can be seen historic maxima were being reached immediately before and during the Sept. 8-9 wind event.

So we had unsecured fires burning out ahead of these winds. Folks on the fire had several days warning, but resources were already stretched thin. Fire managers know that any open fireline backing to the south and west against the prevailing southwesterly wind was subject to becoming a raging head fire with the upcoming wind shift. Crews battened down the hatches and largely backed out and stayed safe on the morning of September 8th when the winds appeared and the fires roared to life.
This season may have fewer firefighters available as in previous years, due to the COVID-19 pandemic, but fire managers have a few tools that are tireless and don’t get sick very often. Sometimes they’re down for maintenance, but the remote-sensed wildland fire data available today is far more abundant, diverse and sophisticated than in the past.
NIROPS and Other Fixed Wing Assets
The National Infrared Operations (NIROPS) is a U.S. Forest Service program that uses infrared detection from small fixed-wing aircraft that fly their missions at night, collecting imagery, and delivering it to infrared interpreters that work through the early morning hours producing maps in .pdf format with both topographic and aerial photo backgrounds. They also produce a bundle of shapefiles that are date and time stamped and include:
· The heat perimeter (polygon),
· areas of intense heat (polygon),
· areas of scattered heat (polygon),
· and isolated heat sources (point)
They usually also produce a .kmz file for viewing the perimeter in Google Earth, and all the information is placed in a folder on the National Interagency Fire Center (NIFC) FTP site. In the last few years other fixed-wing platforms have become available, like the Colorado State Multi-Mission Aircraft (MMA) and the Air National Guard’s Distributed Real Time IR or DIRTI-bird. Unmanned aircraft systems (UAS) are coming more online, as well, and a comprehensive discussion can be found here. NIROPS was still the first, and hearkens back to a time when the imagery, collected on photographic film in the aircraft, was then put in a tube and dropped by streamer to the photo-interpreter waiting on the ground.
Satellite-based Platforms
First there was the Moderate Resolution Imaging Spectroradiometer (MODIS) on NASA’s earth observation satellites Aqua and Terra in the early 2000’s. It had 1 km resolution. Now we have better 375m resolution heat detection in the Visible Infrared Imaging Radiometer Suite (VIIRS) based on the NOAA-20 satellites. The primary disadvantages of the satellite-based heat detection systems are the poor resolution and the many ways false signals can be generated, such as reflections off a canyon wall and signals generated when the satellite lens is looking through the heat column of a large, intense fire.
Satellite systems have the advantage of regularity, passing over the fire a certain number of times in a 24-hr period. Fixed-wing platforms, like NIROPS, happen usually between 10pm and 3am each evening, as long as the aircraft is not down for maintenance. Some of the newer fixed-wing aircraft only produce thermal still or animated imagery, some fly only in the daytime, and some do not produce GIS perimeter shapefiles, like NIROPS. The entire ecosystem of remote-sensed fire detection information is getting more crowded. One of the newer sites that hosts all of this incident information is the Fire Enterprise Geospatial Portal or EGP. This is a major step up from the NIFC FTP site, as all the information is viewable in a map server.
Perimeters, Severity and Rate of Spread
Both satellite and fixed-wing heat detection platforms are simply a snaphot in time. While the intense heat polygons generated by NIROPS may give an indication of where the greatest heat is generated, the most important thing revealed by these systems is rate of spread. Since each of these images represents about a 24-hr period, one can see how openings in the forest canopy created by clearcuts and industrial tree farms channel the fire spread. This is due to the absence of the wind reduction factor introduced by an intact canopy of mature overstory trees. That’s right, the ones they want to cut down for a profit. The very same trees that are doing the most at sequestering carbon from the atmosphere.
![wind_friction[1].jpg](https://images.squarespace-cdn.com/content/v1/5e2c7d5a807d5d13389c0db6/1600804936434-S0LLAYR9DW8OW1WCEOO3/wind_friction%5B1%5D.jpg)
![wind_shelter[1].jpg](https://images.squarespace-cdn.com/content/v1/5e2c7d5a807d5d13389c0db6/1600804953497-Q25EYPAVTICYU7XNUB98/wind_shelter%5B1%5D.jpg)
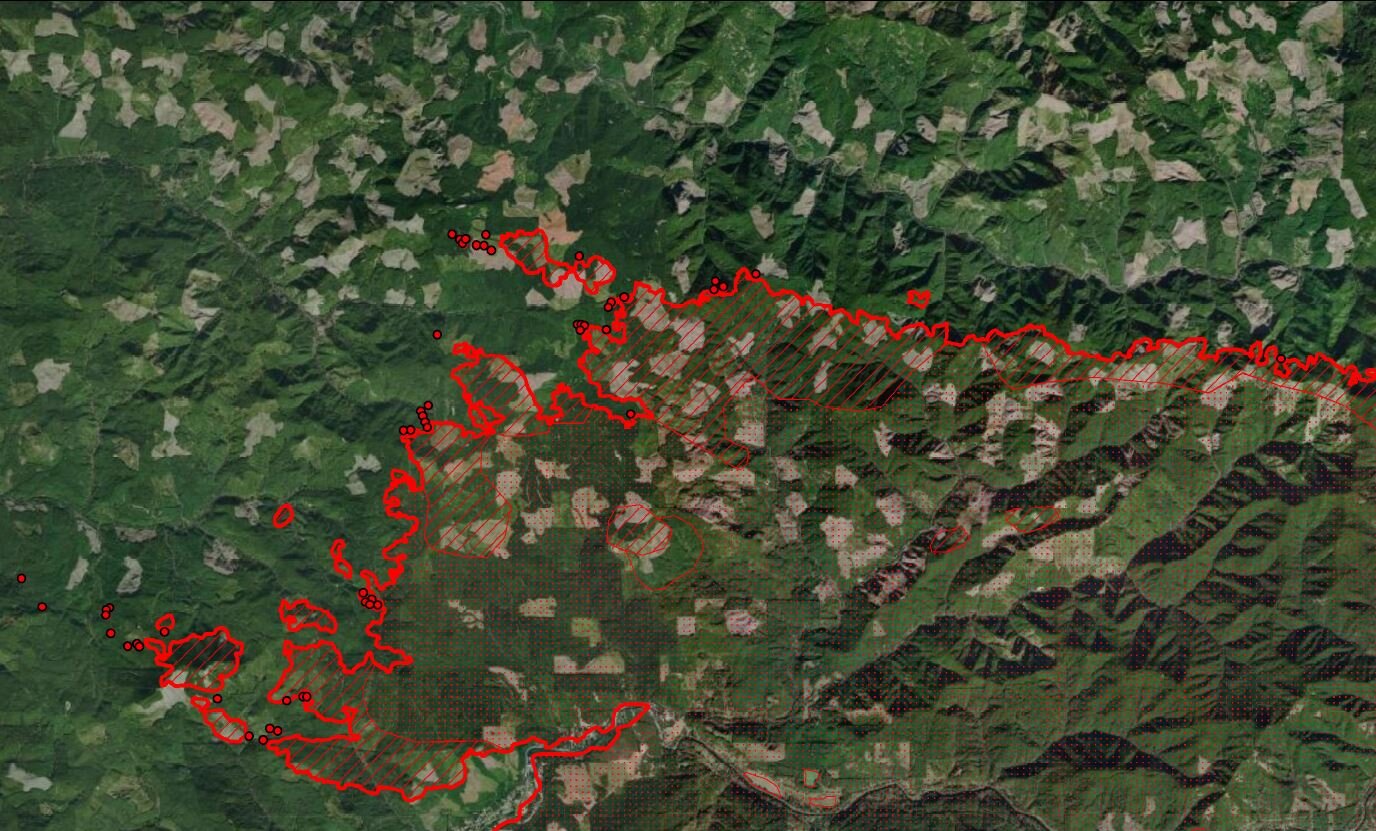
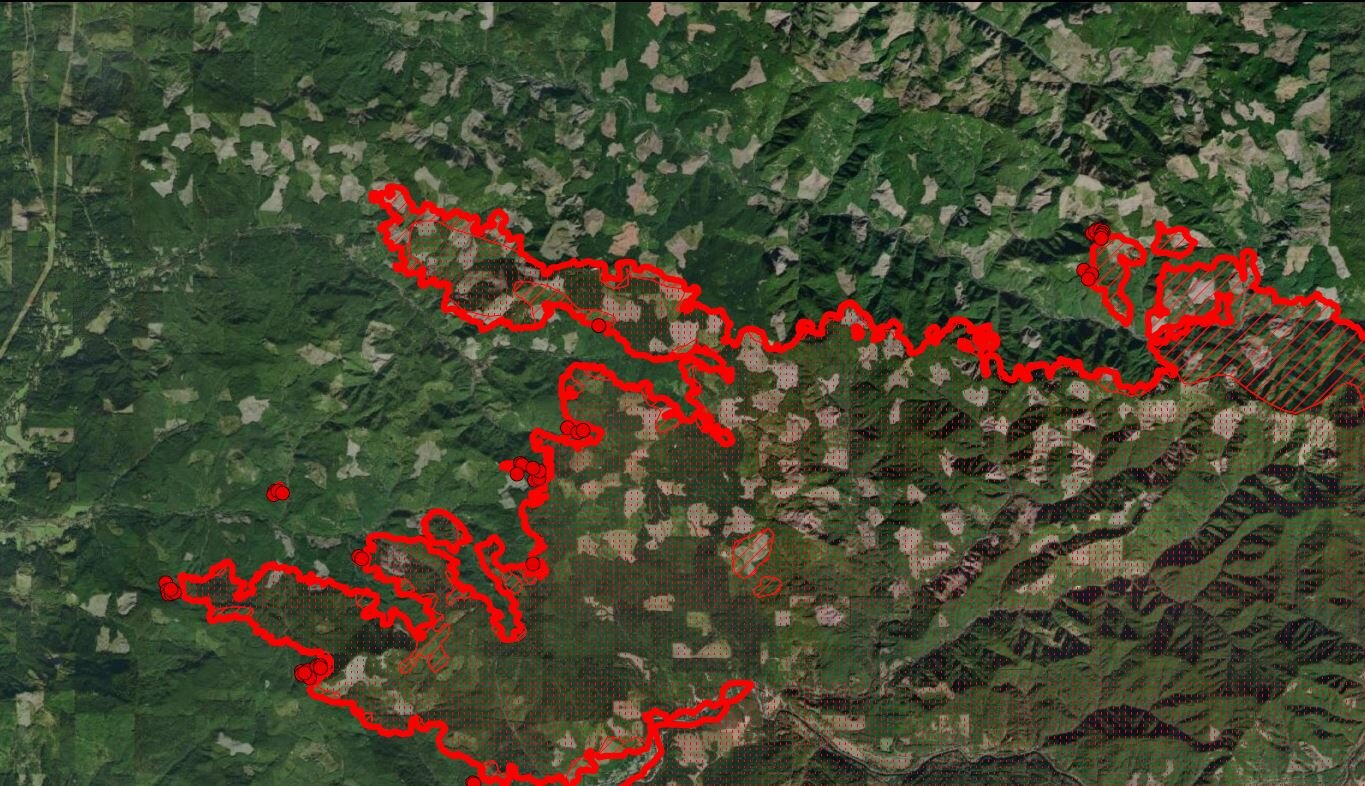
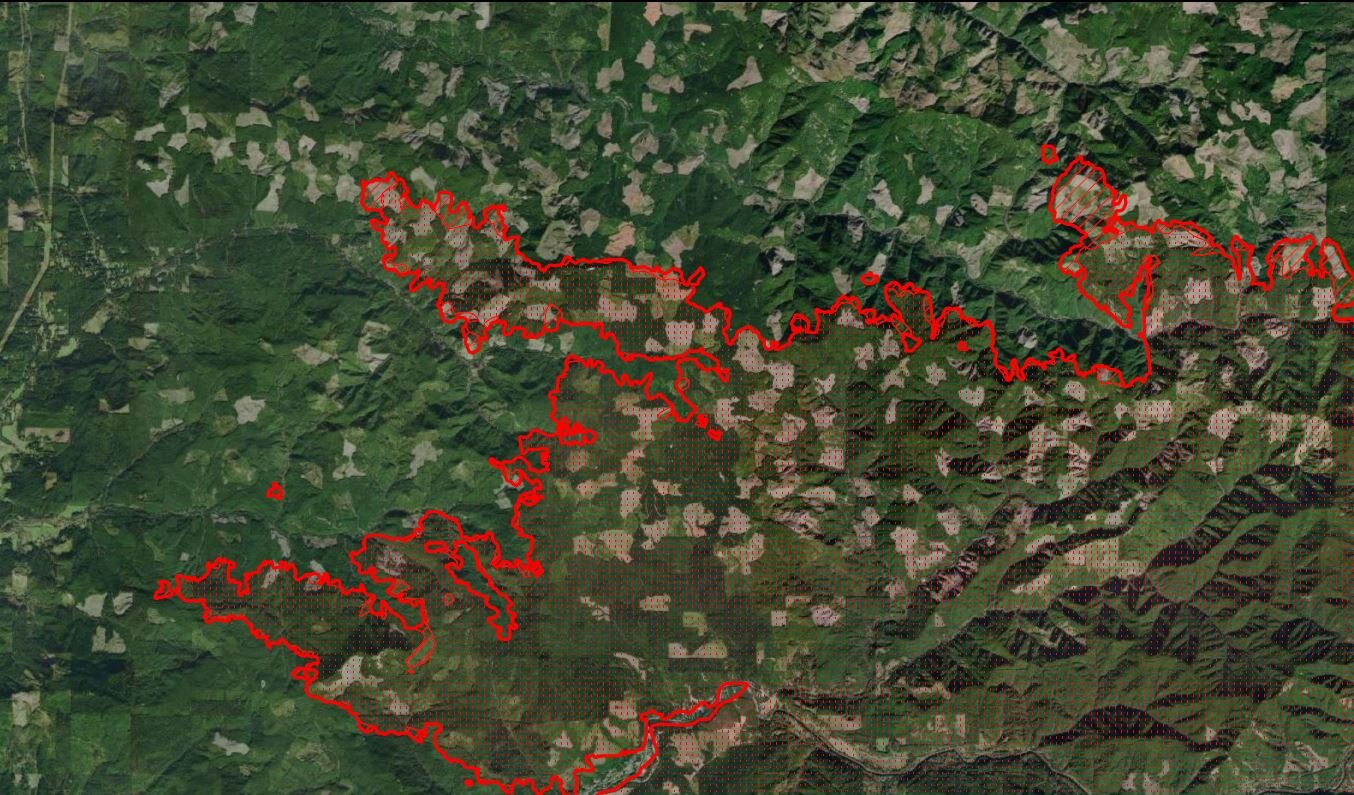
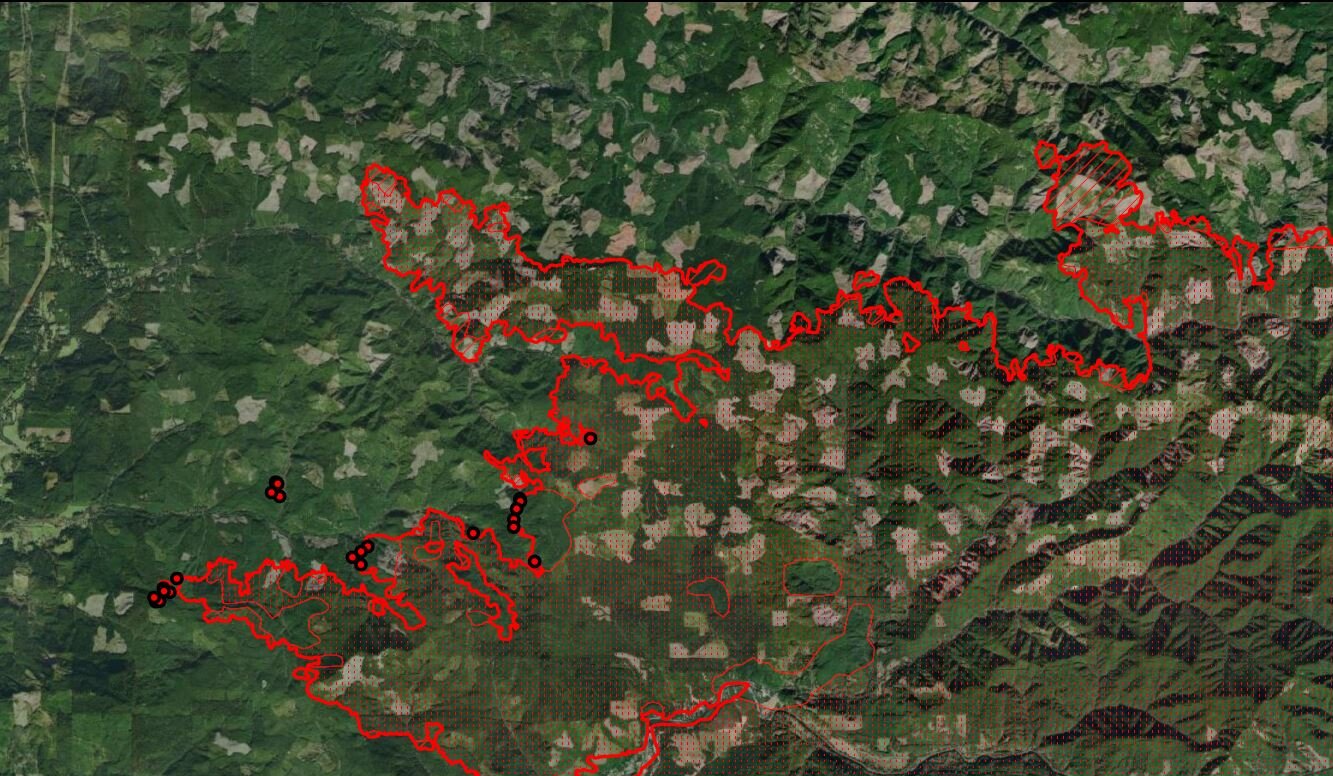
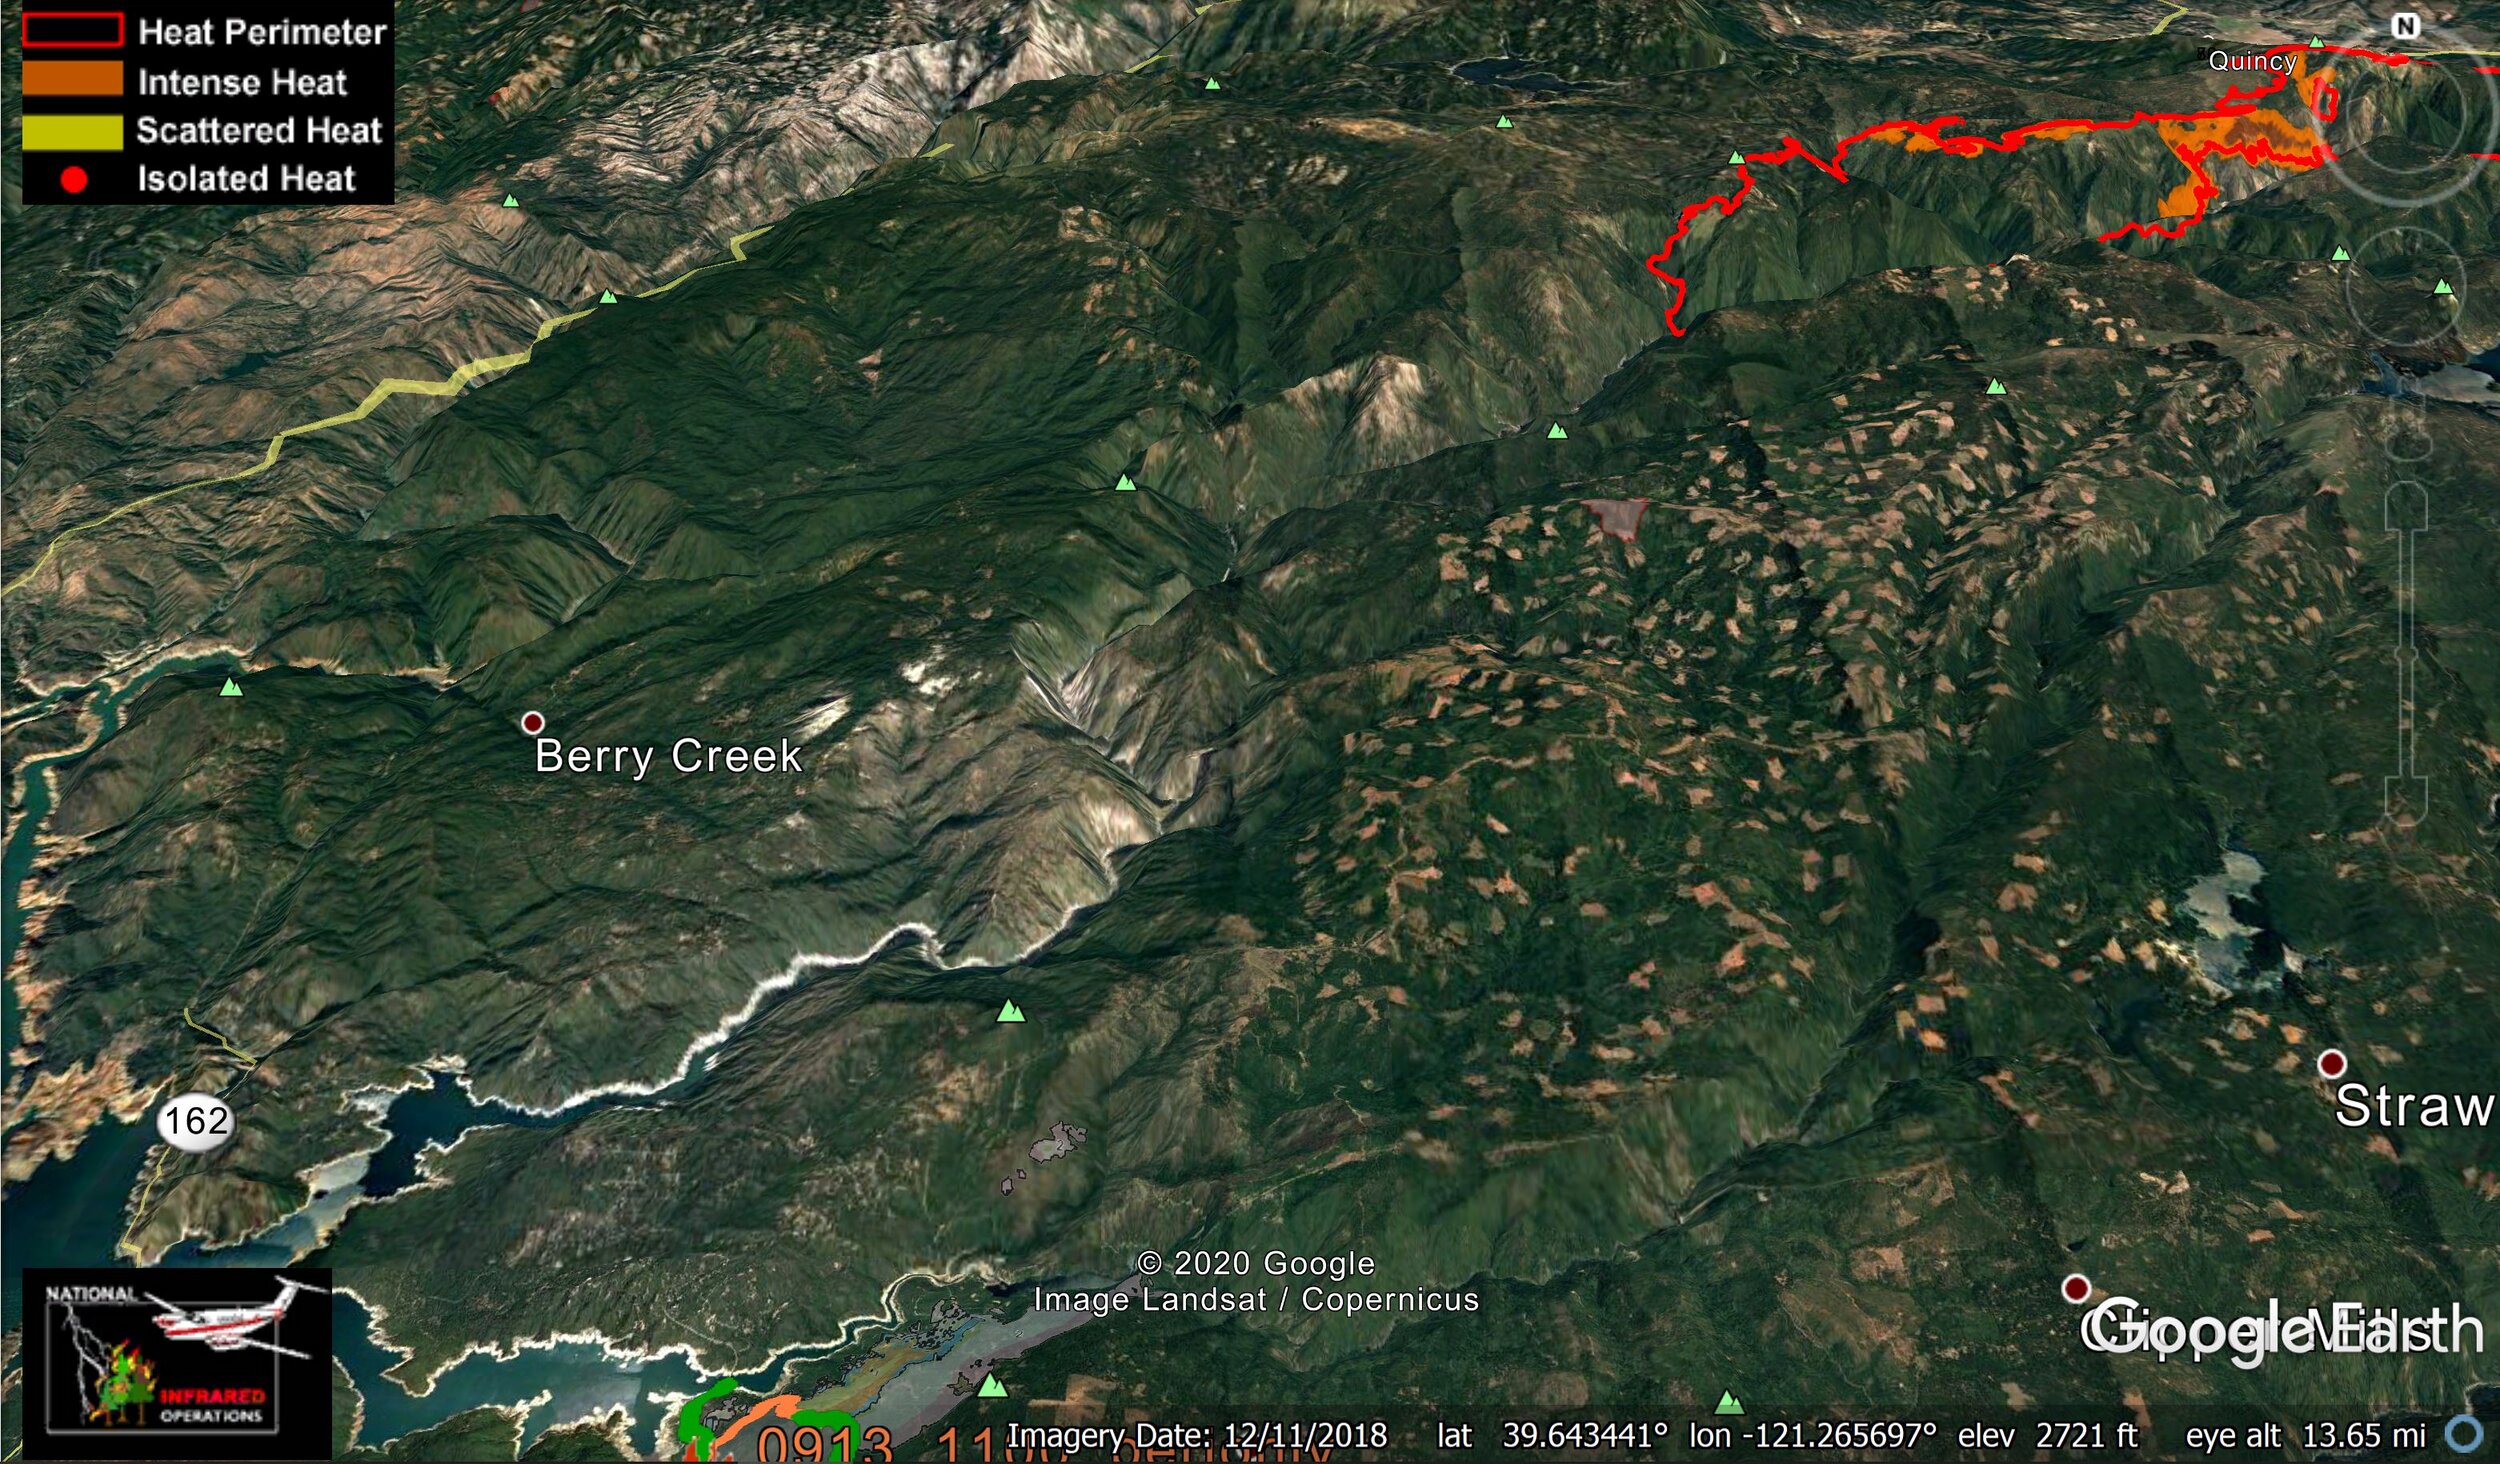
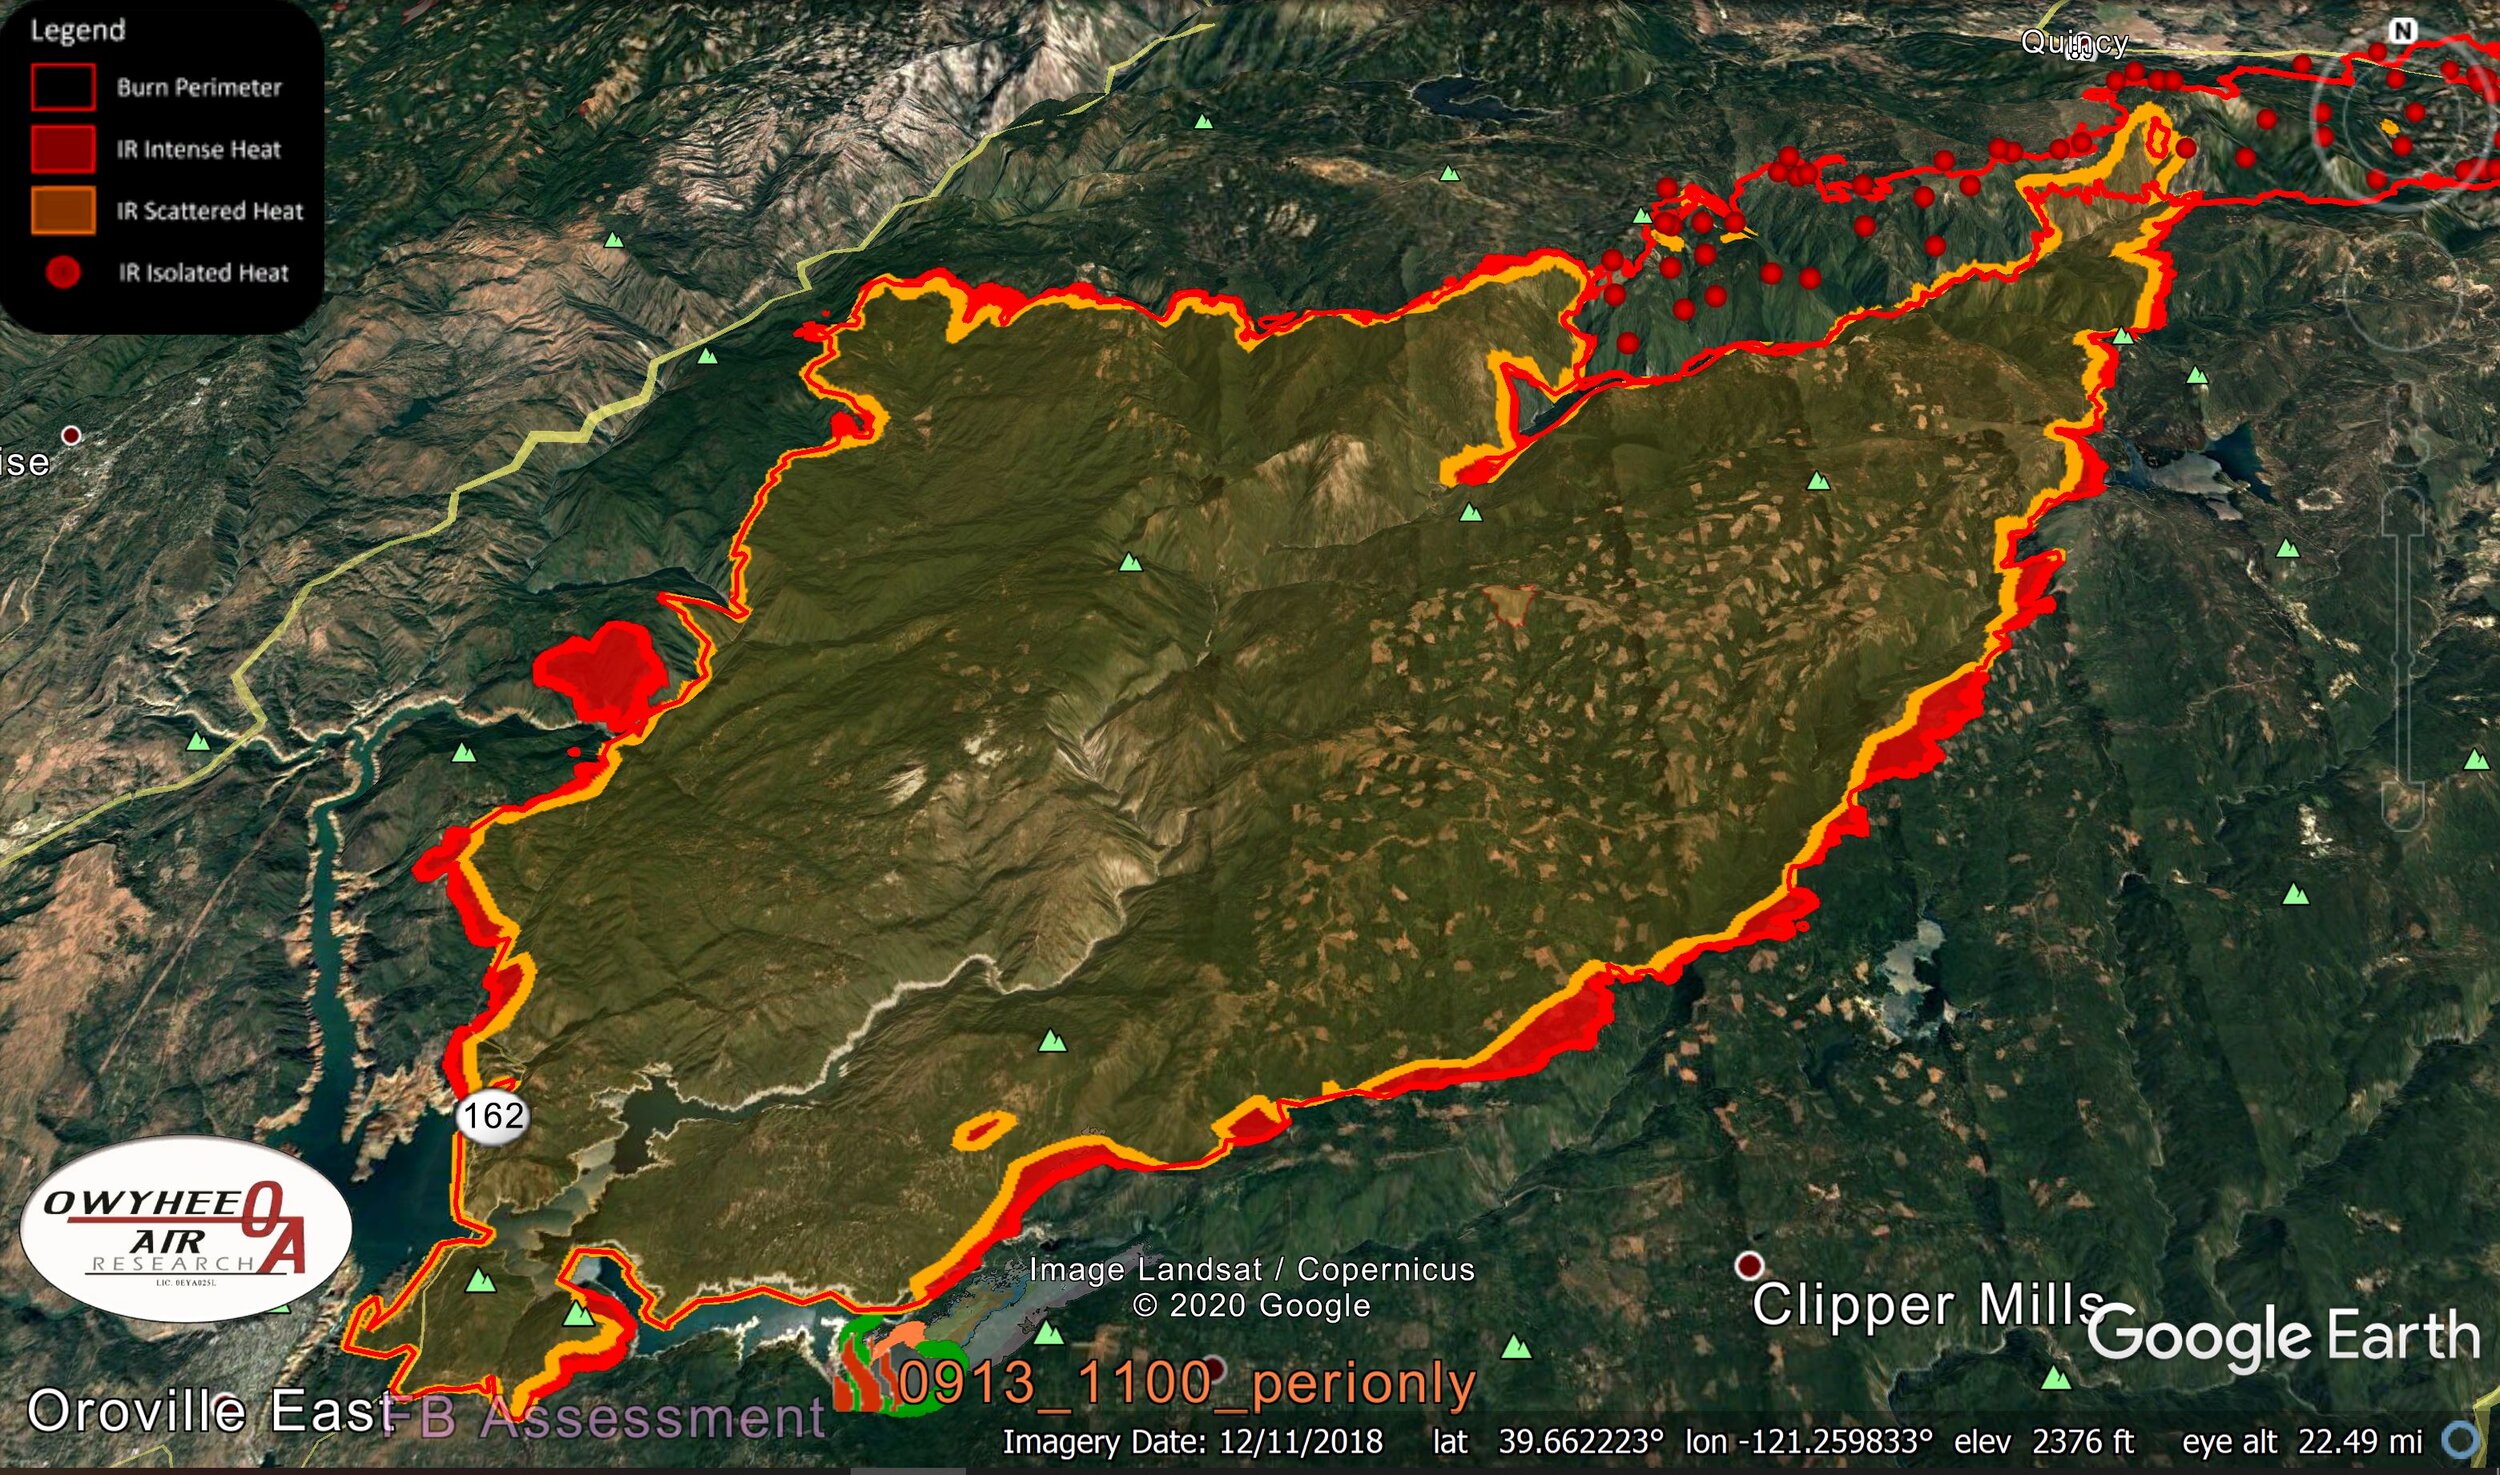
The surface wind speed in a closed canopy forest may be as little as a fifth of the speed of the winds aloft, above the canopy. So, it is no surprise that these sites are drier and more receptive to embers spotting or spotfires. And, if there is a lot of coarse woody debris left behind in, say, a clearcut, then greater severity may also be observed. In the sequences below, we see how the forest openings, borne of so-called active forest management, channeled the Holiday Farm Fire east of Eugene and possibly the Bear Fire north of Sacramento that traveled an astounding 30-plus miles in a few hours from high in the Sierras all the way down the Feather River Canyon to Lake Oroville Each photo is roughly 24 hours apart during the peak of the Sept. 8th and 9th wind event and uses NIROPS data. The first four slides are the Holiday Farm Fire, and you can see, once the wind subsides the elongated elliptical “fingering” slows or stops, and the fire shifts back to just normal backing and flanking spread. In the last two slides - we only have two because the event happened so quickly - we see the Bear Fire, part of the North Complex on the Plumas National Forest. This fire had been languishing and was thought nearly out, but then the east winds came. The fire came roaring out of the Feather River Canyon and erased the community of Berry Creek. Whether it was the Feather River Canyon or the mass of SPI clearcuts south of the river that directed and focused the spread, we may never know, but it certainly raises questions about a heavily managed forest vs. a more intact canopy. Why would we want to replace mature tree stands with flammable young timber farms, made even more flammable by the application of herbicides to promote mortality in broad-leafed species…more dead fuel?
Now, a word about fire severity. Severity speaks to soil and vegetation heating and damage, primarily. One measurement of severity might be % crown scorch, another might be % tree mortality in different tree species and size classes, and another might be soil impacts. Fire severity is a component of a fire regime. A dry pine forest in the Southwest or West Coast has a much different fire regime than, say, a Rocky Mountain lodgepole pine forest. The main way to get post-fire severity data is through the monitoring trends in burn severity (MTBS) website. It comes from differences in Landsat satellite imagery per- and post-burn. Land managers can request this information directly from MTBS to help direct burned-area emergency rehabilitation (BAER) efforts that begin before the fire is completely out. Otherwise, it seems to take a couple of years for the information to appear on the MTBS website. For instance, the 2018 data is just now being made available.
Fire ecology and fire science researchers conduct even greater analysis and refinement to the raw Normalized Burn Ratio (NBR) data obtained from NTBS, and all of this takes time. This is why we cannot draw too many conclusions from the initial perimeter data derived from remote-sensed thermal information that is only showing us a perimeter at a certain point in time. But there have been plenty of research papers suggesting greater severity, and what we can visibly see - greater rates of spread - in these areas that have been over-managed with commercial logging and industrial tree planting, usually located in a landscape that has been under-managed in terms of using fire as a tool.